Visualize your traffic (to work)!
04 Jun 2013I recently started commuting from and to work by car instead of using the subway. This – sadly – was not by choice but rather because a) I broke my foot and b) the subway does not currently go straight to work but you have to use a shuttle bus.
When we started commuting by car, we noticed that traffic patterns differed quite a bit depending on time, day and weather. I wouldn’t say there’s a huge advantage you can get from knowing all about the traffic patterns. Maybe, though, you can do less experimenting and more knowing when it comes to determining the best moment to start the commute to work and thus minimize the amount of time spend on the road. If you will, this can be viewed as a more technology driven approach to the commute time minimizations done by Mason Chang that I recently enjoyed reading.
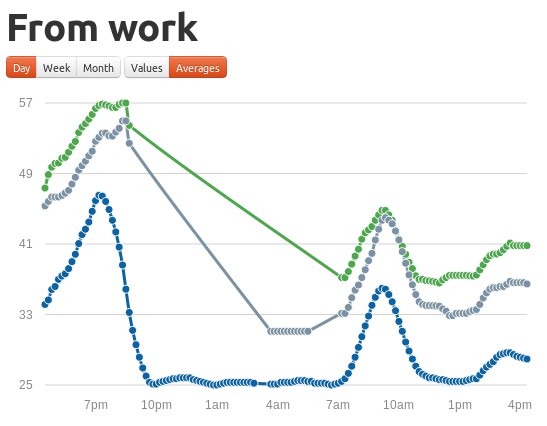
On the right, you can see my solution to the problem so far. From a technical perspective, there is essential two main components; the screen scraper and the client-side visualization hosted via nginx.
Scraping the traffic data is extremely simple and could be achived using only bash scripting and cron. I opted, however, for using a css selector library that works with node.js due to the obvious comfort and because all my previous screenscrapers were in ruby and I wanted to learn something new. At first, I only implemented logging to a text file (node scraper.js >> logfile) but later added a database backend as I have started logging more routes than just my current way to work. In the future, I might post on screen scraping more complex websites but for traffic information there’s nothing in place like referrer validation, cookies, rate limiting etc. – it comes down to a get-request and then extracting one number from the html source which is very doable.
For visualization inside the browser, the traffic data file is fetched from the server and rendered using the excellent morris.js graph library. The layout is some bootstrap variation, everything is componentized using can.js. Another nice addition to the usually ginormously high node.js and javascript frontend stack is JamJS which is used to manage all front-end assets. This is actually a gem I stumbled upon by surprise a couple of days ago: Jam essentially has a big repository of frontend javascript packages together with all settings needed to make them work with require.js. First of all, this makes writing huge require configs a thing of the past, second you can reuse whatever packages you submit to the JamJS repository in other projects, I for one added morris.js to the repository.
Though rudimentary, it’s not too hard to obverse traffic patterns and adjust accordingly using the resulting graphs. Additionally, non-periodical events can be observed: When Munich won the Champions League final, you were able to observe about 5 minutes of delay on my route to work (at 11pm) due to the cars streaming into the city to drive up and down Leopoldstraße.