Building your own more expensive Nest: Arduino, Android, React Native.

I recently bought a used Fiat 500e, naturally I set out to reverse engineer the CAN bus in it. That led me to discover Arduinos (which I knew existed but had never used) as well as ESP8266s. I had previously used FHEM to wire up my heater in Germany but it felt outdated even in 2011, much more so now so I decided to go for something prettier.

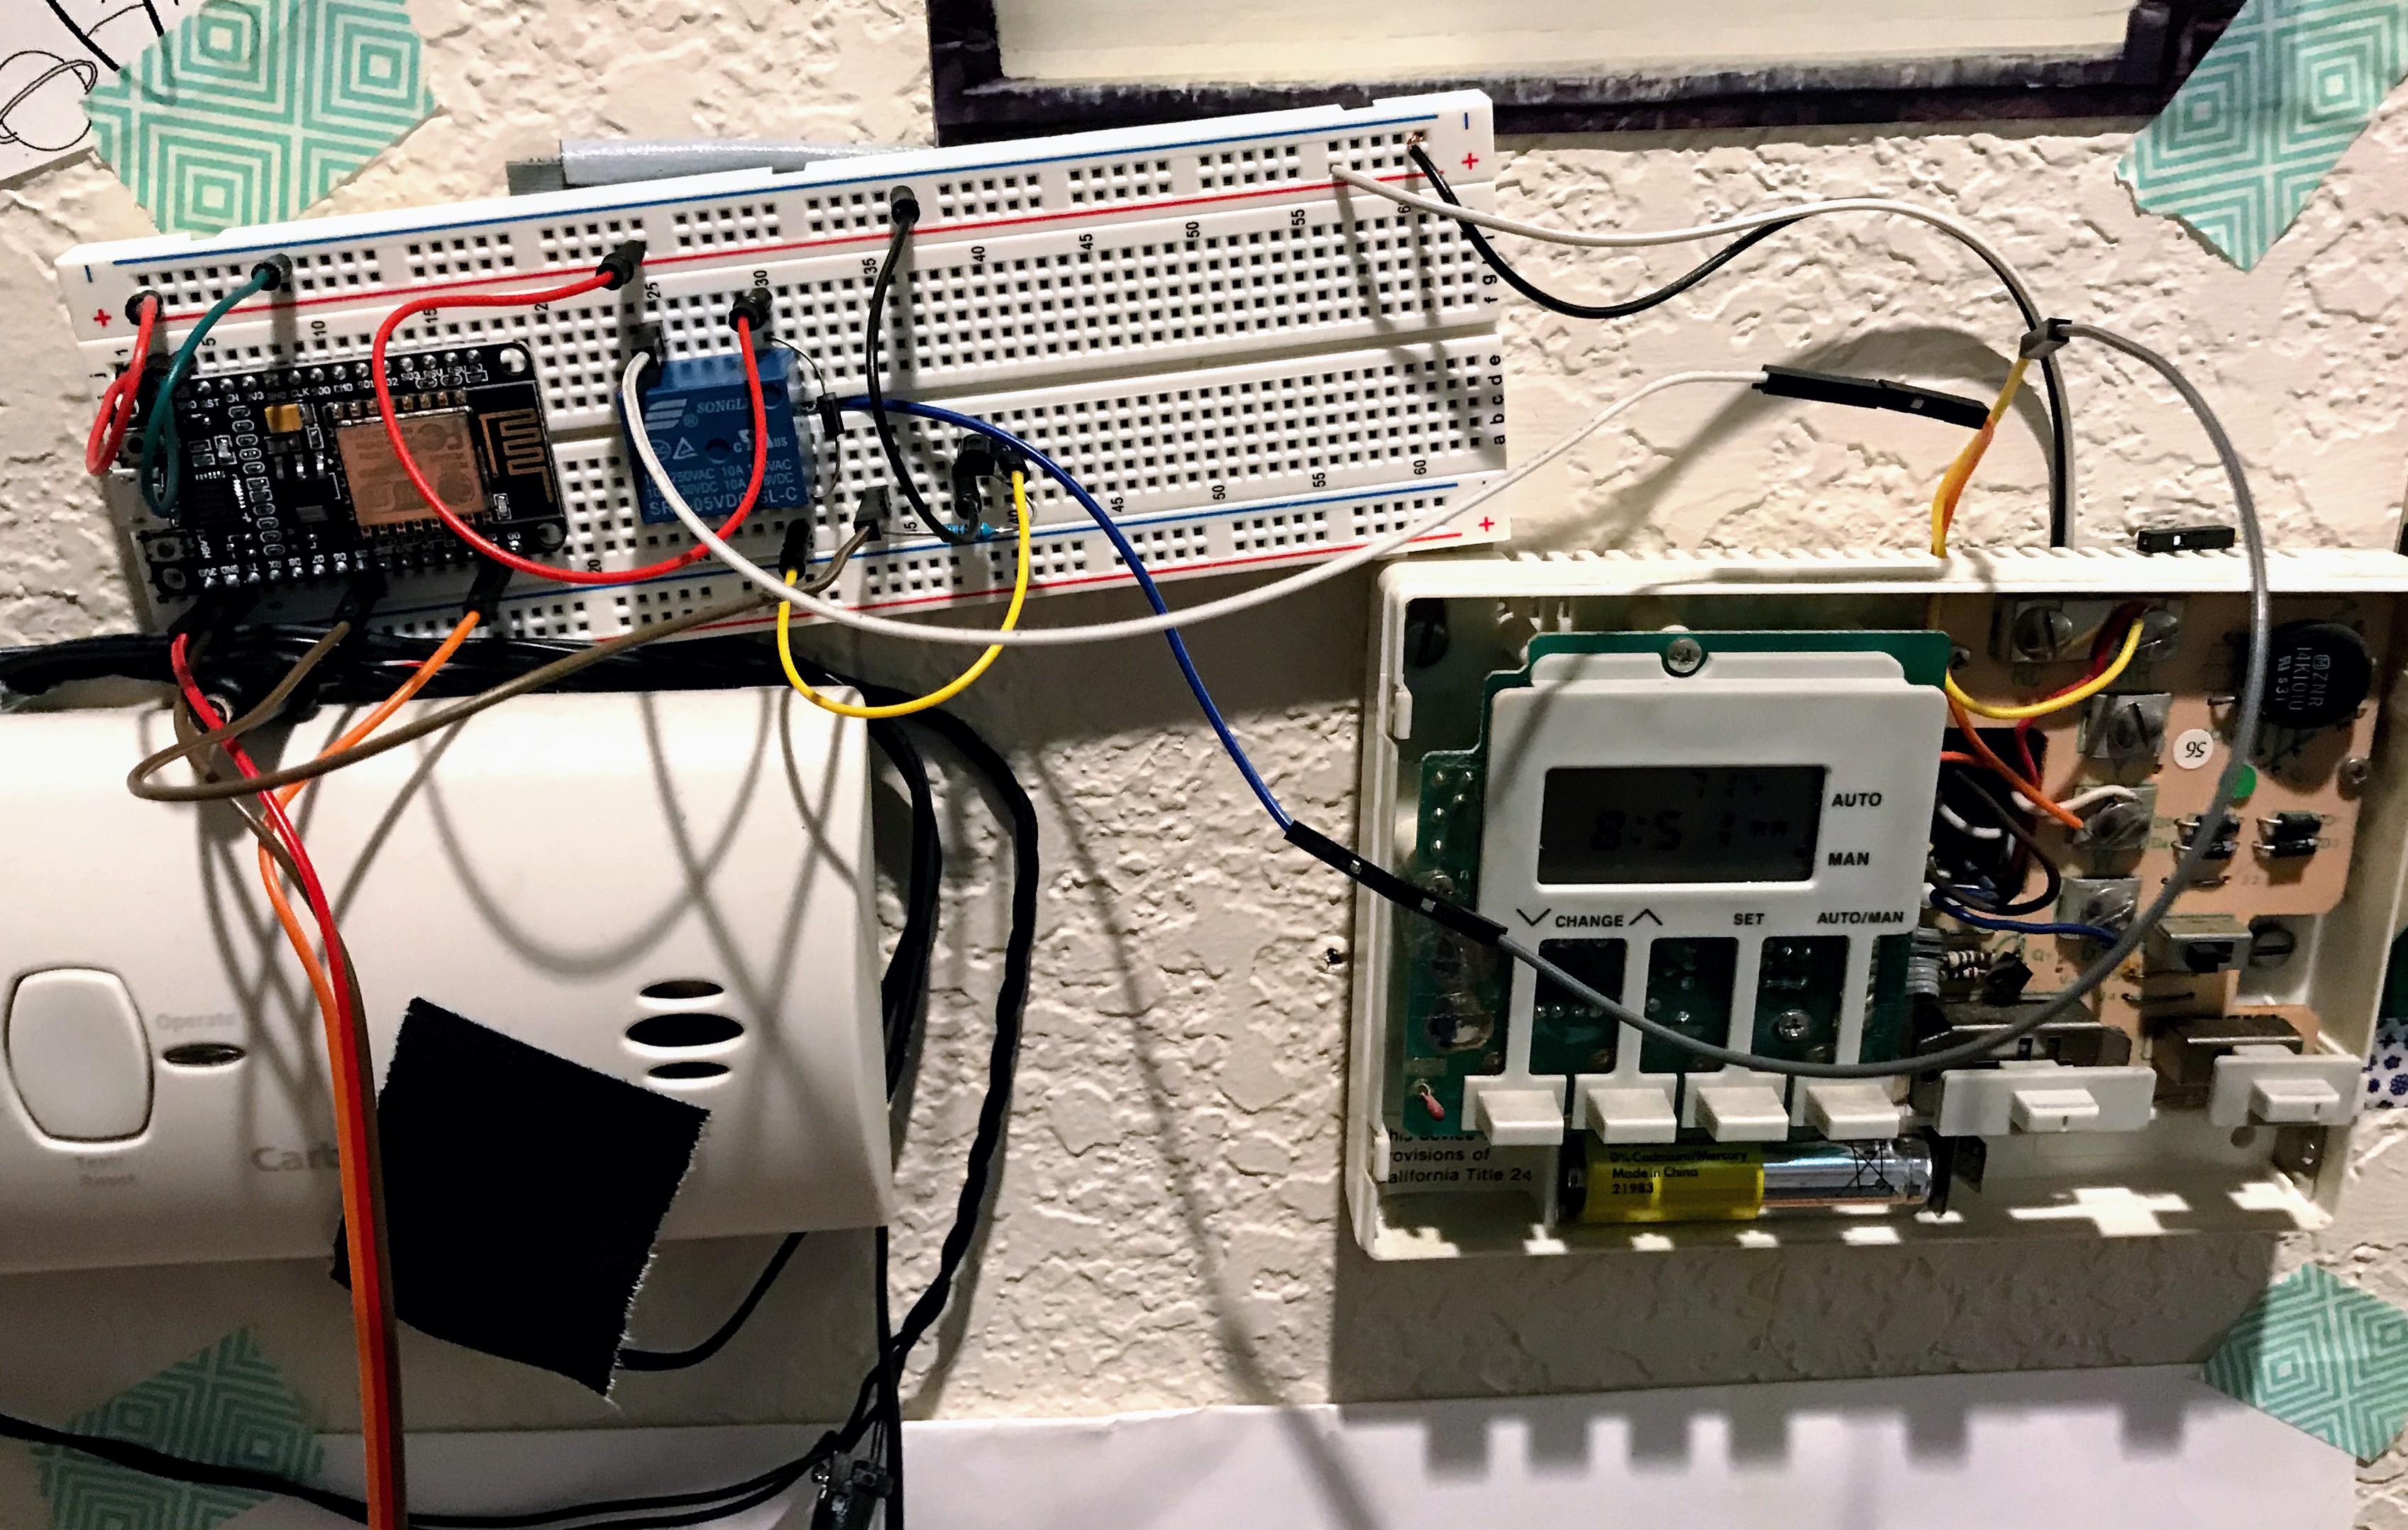
I first build a prototype on a breadboard that could connect to our wifi and control the heater. The Arduino acts as a temperature sensor as well as a way of switching our heater on. It however does not implement any control mechanism, instead it subscribes and publishes to an MQTT server and the actual control-loop is implemented using Node-RED. This seems beneficial as it is much easier to maintain software on a Linux machine than OTA updating an Arduino. Also, it allows leveraging cool plugins available in Node-RED.

Node-RED, for instance, has a plugin to do PID control, a plugin for geofencing as well as a plugin for sending and receiving messages from Telegram. I’ve leveraged these to turn the heater off when no one is home and to allow controlling both our heater as well as smart outlets through telegram. This avoids having to go through random Cloud services operated by the creators of our smart plugs and instead allows keeping the connection local (and trust Telegram, but that’s only russian Facebook so that seems reasonable?).

The breadboard + Node-RED setup seemed nice enough, but I can’t exactly replace our very outdated looking heater controller with a breadboard and no buttons. At the end of the day, sometimes, it’s not my loving wife (who’s willing to control the heater with Telegram) who is here with me but maybe a visitor. Maybe we forgot a phone. It would sure be nice if there was an adequat way of controlling the heater from the wall as well.

Since I had discovered Arduinos, everything looked like a nail now. So I soldered up a TFT display to another ESP8266 to build a touch screen interface for the heater.

Of course this looked a bit DIY so I decided I need an enclosure. Googling that, people usually 3d print those so I bought an Ender 3 3D printer, learned OpenSCAD and designed a bezel for the TFT. Then I realized that this is completely crazy: There’s already high quality TFTs with high quality software development frameworks bundled in a pretty package - Android tablets. So I pivoted!

I had experimented with React Native on iOS once 2 years ago while baby-sitting my then-very-little daughter and it was a neat eperience, largely because I didn’t have to write any of the Apple languages. This time, I again gravitated to that, since I like react for frontends and already speak reasonable and modern JS. I hacked up a prototype, and put it on the tablet. Satisfied with the result, I started worrying about mounting the tablet on our wall. The 3D printer came in handy for that. For reasons I don’t fully understand yet, I couldn’t find any V-slot based mounts on Thingiverse so I designed one in OpenSCAD and then used it to make a wall holder that matches our old heater thermostat. The mating parts I epoxied to the tablet itself - the tablet sat in a drawer for 2 years and costs $37 new so it feels like any non invasive way of attaching the V-shaped pieces is overkill.

This is the tablet including the current state of the software, mounted to the wall:

It also shows that I added a few smart-switches to the mix. They are reflashed Sonoff S31s which is a smart switch based on ESP8266 controllers. The key reason for using Sonoff switches is that I am not touching any 110V AC hardware because I really enjoy living.

The OpenSCAD-created 3D model of the mount looks like this (the Vs need to face so as to counter gravity though):

Glued-up tablet:

Was it worth it?

Negatives

  • Inferior to any commerical solution.
  • Cost:
    • $300 3D printer and accessories,
    • $200 Arduino stuff, and
    • $40 tablet.

Positives

  • Dabbled with
    • React Native,
    • ESP8266 and Arduinos in general,
    • 3D Printers,
    • OpenSCAD, and
    • Electronics!

Overall this was quite worthwhile, not because of the awesome cheap product (it looks pretty slick though), but because of the amount I learned and tinkered with which I usually don’t.

If you’d like to know about any particular part of this, let me know.

Comments

Reverse-engineering exact location information through trilateration.

Many datasets on the internet accidentally expose location information by allowing distance based search (“find everything within 3 miles around this point”) from arbitrary points of origin. I happened upon such a dataset and wanted to try rediscover the original location through trilateration.

Trilateration, which is commonly wrongly referred to as triangulation, is the process of finding a location L given three other locations A, B, C and their distance to L (let’s call that dA, dB and dC). Very surprisingly to me, I was not able to find a lot of good, sure-fire solutions to this easily when I wanted to solve a trilateration problem so there’s a summary of what I found.

Code is here.

A linear algebra approach.

Given the aforementioned setup with absolutely accurate values and under the assumption that the earth is flat, L can be found by finding the intersection of the three circles around A, B and C with their respective diameters. Unfortunately, neither is the earth flat nor du we commonly have perfect values for the diameters (and potentially the coordinates of A, B and C).

With reasonably good data however, we can compute L as the intersection of the spheres around A, B and C with their respective diameters. Let’s look at that, I hacked together this 3d demo (this is zoom and panable by dragging and mouse wheel scrolling):

In this example, the three known points are Moscow, Madrid and London and the diameters are the distance from Munich, Germany calculated using the Haversine formula. If you zoom into the intersection of the spheres, we actually do hit Munich pretty well and the spheres don’t seem to overlap so that’s a start.

Let’s assume our input is 3 sets of latitude/longitude and distance in kilometers. We need to map this to a coordinate system where we can actually determine the intersection somewhat easily. A good candidate is ECEF. Ideally, a library should be used as this gets iffy very quickly. Forward mapping from geo coordinates to ECEF is still reasonably straight forward, the back-mapping is an iterative algorithm and not trivial. A great library for this with bindings to many languages is PROJ.4.

Once we’ve mapped the geo coordinates to xyz coordinates on the earth’s ellipsoid’s surface, we can now proceed to determining the intersection of the spheres around our xyz points and map the point of intersection back to geo coordinates using PROJ4. Determining the intersection can be done as described in this stackexchange post. The post suggests manually converting coordinates back and forth between ECEF and geo coordinates; I’ll show in the next section why that may not be such a good idea.

Trying it:

The reason I am investigating this is that I happened upon a website which allows me to search for things sorting them by distance from my location. It does not reveal the location of the search results. I figured I may be able to search for them from 3 different locations and do the trilateration, which, when tried visually by drawing circles on Google Maps, looked very promising.

I first tried the approach posted here. This does in fact yield points which are in the right vicinity but not quite where the location actually is. I initially only looked at the distance between the trilateration results and the actual location. Plotting the results on a map is a lot more helpful in understanding what the problem is:

The actual location is Haimhausen. We observe two problems: First, the points used for A, B and C are all south-east of Haimhausen. It looks like we are a little short of the target in the east-west axis. Then, much worse, the points seem quite spread out on the north-south axis. This led me to suspect that the conversion from geo to ECEF listed on stack overflow is not quite accurate enough for what I wanted. The post mentions that “if using an ellipsoid this step is slightly different” which is quite the understatement. In fact, the code for doing the proper ECEF conversion is fantastically more complicated. A good example for validating ones implementation (and for looking at the code used in their implementation) can be found here.

I decided to try using python’s PROJ.4 bindings to make this projection easier and see if it improves the result at all. Low and behold, using an ellipsoid:

This is vastly better than before. North-south as well as west-east axis seem to be about equally skewed now. I was however still convinced that this could be improved. My suspicion was that the distance metric used for calculating the geo-coordiante distance pairs on the server differed from Haversine or Vincenty. I played around with the numbers a little bit but eventually tried multiplying all distances with a small factor. This yields a much better result and makes the trilaterated points cluster a lot more densely. I tried this with many known points from the dataset and this constant helps all trilaterations about equally. It looks like internally, the source of the data set maps all geo coordiantes on a flat x-y plane and calculates distances on that plane. Result with the correction factor:

The reason I’m showing more than one result point is because I actually have 10 source points with distances and this is the trilateration algorithm run on each combination of three out of those 10 source points.

Trilateration as an optimization problem.

I mentioned this to a friend who suggested thinking about it as an optimization problem. I pondered this for a bit and googled it and that quickly got me excited: We can likely express this in a fairly clean way and have all the hard work be done by a nonlinear solver. This reduces code, does away with coordinate system conversions and - even better - allows taking all source points into account at the same time.

I hacked this up in python. We try to optimize the squared difference of the distances from target point L to all input points A, B, … etc. Let’s assume L is an array consisting of latitude and longitude and the input points are an array points consisting of one array per point containing latitude, longitude and distance in that order. The python now comes out to this:

def distfunc(L, points):
    distsum = 0
    for c in points:
        dist = vincenty([L[0],L[1]], [c[1],c[0]]) - c[2]
        distsum += dist*dist
    return distsum

We can use scipy.optimize to minimize distfunc using the fmin_powell method. This comes down to:

L = scipy.optimize.fmin_powell(distfunc, [0,0], args=(points,), xtol=0.0001, ftol=0.0001, disp=False)

One thing we have to do, however is to either pick the initial guess ([0,0] in the example call) close to the answer or we have to make sure that distfunc returns something large for values of L for which it is not defined. Otherwise, the result will be outside of the range of valid geo coordinates simply because the vincenty function does produce distances even for illegal inputs, expect for the fact that they are not well-defined.

In addition to constraining illegal values for L, for my input data set I had to take the fact that all distances seemed to be off by a factor into account. This can be easily done using this approach by adding a third variable to L and having it optimized as well, which is the magic factor. This changes the distance computation to

  dist = vincenty([L[0],L[1]], [c[1],c[0]]) - L[2]*c[2]

and requires for the initial guess to be extended by one more zero to [0,0,0]. I tried the algorithm with a dataset which had 30 points with distances and a known result for L. The following list is the number of points together with median, average and 90th-percentile error from the actual point in kilometers.

3 Median: 15.916440 Average: 13.894293 90th-percentile: 18.584305
4 Median: 14.115303 Average:  9.638456 90th-percentile: 17.695530
5 Median: 14.087114 Average: 10.022226 90th-percentile: 17.623656
6 Median: 14.207656 Average: 12.087994 90th-percentile: 20.107994
7 Median: 14.012734 Average: 12.129031 90th-percentile: 20.082207
8 Median:  0.000563 Average:  0.000600 90th-percentile:  0.000651
9 Median:  0.000549 Average:  0.000555 90th-percentile:  0.000639
10 Median: 0.000534 Average:  0.004449 90th-percentile:  0.000802

With 10 points, the error is 50 centimeters (less than 2 feet). Seeing as most geo coordinates in databases are probably geocoded, this is more than enough for reconstructing the original address of a point. Visually, the red pin is the original, the blue one is the trilatered point:

I know, the red one is basically invisible. Let’s zoom in:

A remaining question is why this only starts delivering good results at 8 points and not less. I am guessing this is because of the introduction of the additional distance factor which is only correctly determined with 8 or more points. Since the API I am reverse trilaterating allows me to essentially get an unlimited number of points, this is not a big issue.

Protecting yourself from trilateration.

For me, it’s great that I can recover the location information from the provided data; it gives me an edge over other consumers of the data. In general though, you probably don’t want to make this mistake and protect the location information your customers enter into your website. This is actually subtle. At first sight, adding a random number to all reported distances seems like an easy fix. Let’s do that and run the optimization algorithm again. This is with 250m added in either direction for every coordinate:

  7 Median: 0.177487 Average: 5.900967 90th-percentile: 17.687421
  8 Median: 0.161858 Average: 0.171432 90th-percentile: 0.213890

Well, this is already 200m accurate at 8 points. We can improve by using way more points:

  31 Median: 0.121494 Average: 0.121494 90th-percentile: 0.121494

Even though we added ±250m to all points, we found the original coordinates with error of only 120 meters. This is what that looks like:

That’s not that far off and we can do even better by adding more points (even though this gets better quite slowly).

From my point of view, what one has to do is NOT use the user supplied geo location in the distance formula to begin with. For instance, one could select a representative point P within 500 meters and calculate all distances from there. This way, the user supplied location is not even part of the distance calculation and at most the selected representative point can be trilaterated back from the data. However, if the same point P is chosen for any location within 500 meters of it, then a reasonable degree of anonymity can be achieved in urban areas.

The code for this is here.

Comments

Automating allocation reports in Ledger.

Motivation

If you own any stocks or funds you probably want to track the allocation, meaning how much money is in stocks and funds respectively. Some fairly well known low key investment strategies rely on balancing this ratio, for instance this one.

In Ledger, allocations can be modelled easily through allocation based accounts and automatic transactions. This is outlined here. If you do this however, you still have to manually update allocations for every fund you own which is a nuisance, especially if you own something like a target retirement investment fund which naturally and purposefully changes its allocation strategy over time.

In a nutshell, we need an automated way of creating records like this:

= expr ( commodity == 'VFIFX' and account =~ /^Assets:/ )
    (Allocation:Cash)                    0.0178
    (Allocation:Stock:US Stock)          0.5383
    (Allocation:Stock:Non US Stock)      0.34259999999999996
    (Allocation:Bond)                    0.0968
    (Allocation:Other)                   0.0045000000000000005

This would then allow fun queries like

ledger bal Allocation: -X '$'

which roughly yields

200.00$  Allocation
 60.00$    Bond
 20.00$    Cash
  2.00$    Other
118.00$    Stock
 38.00$      Non US Stock
 80.00$      US Stock

or alternatively

ledger bal Allocation: -X '$' -%

which roughly yields

100.00%  Allocation
 30.00%    Bond
 10.00%    Cash
  1.00%    Other
 59.00%    Stock
 19.00%      Non US Stock
 40.00%      US Stock

Automation

A reasonable source for asset allocation per fund is Morningstar. There, each fund has a Portfolio page which shows asset allocation. Let’s try to extract that.

Morningstar's asset allocation page.

First, let’s use Ledger to determine what kind of commodities we might need to figure out allocation for:

# Determine symbols used in ledger.
symbols = `ledger reg --register-format '%(commodity)\n' | sort | uniq`.split

# Remove currencies.
symbols -= ["EURO", "$", "p$", "$p"]

Then we load the Morningstar page and extract all relevant data using Nokogiri. I used Selenium to do scraping for banks before however here that seems like overkill. The website does not rely on Javascript so much, it really just renders HTML server side which, combined with a DOM parser, allows for very easy data extraction.

symbols.each do |symbol|
  # Query morningstar.
  clean_symbol = symbol.gsub(/[^a-zA-Z0-9]/, "")
  doc = Nokogiri::HTML(open("http://portfolios.morningstar.com/fund/summary?t=#{clean_symbol}&region=usa&culture=en-US"))
  table = doc.xpath("//h3[contains(text(), 'Asset Allocation')]/following::tbody[1]")
  category =  doc.xpath("//*[contains(@class, 'categoryName')]/text()")
  rows = table.xpath(".//tr")
  allocation = {}
  rows.each do |row|
    cells = row.xpath(".//*/text()")
    next if cells.size == 0
    allocation[cells[0].to_s] = cells[1].to_s.to_f * 0.01
  end

  # ...
end

Essentially, we use a few XPath expression to find the relevant data in the page and extract the asset allocation. The code ommitted here is a very dumb heuristic to determine allocation when we are not dealing with a fund or when no data is available. We use the category name, which is usually something like “Total Stock Market Fund” or “Total International Bond Market Fund” as a basis for the allocation decision and otherwise just assume it’s a stock for the simple reason that I don’t trade individual bonds.

As usual, the code for this is here.

Comments

Automating commodity prices in Ledger.

Motivation

If you use Ledger CLI, chances are you will use more commodities than just dollar. This is actually one of Ledger’s best features. For instance, I track our 401k in Ledger and it allows me to list the ticker symbols of the funds we have purchased inside the 401k as well as the fact that this is pre-tax money. Our opening balances look something like this:

2016/07/19 * Opening Balance
  Assets:Checking                     $200.00
  Assets:Investments:401              3.1 VFIFX @ p$29.8
  Assets:Investments:401              2.5 VTTSX @ p$29.8
  ...
  Income:Opening Balances

Roughly, this means that we have two different funds in our 401k with ticker symbols VFIFX and VTTSX respectively. Also, the funds are not valued in dollars but in p$ which is our commodity for pre-tax money. The idea is that this money, if accessed today, has a much lower actual value because we’d have to pay federal, state and penality taxes on it. Therefore, the price database for this looks like this

P 2016/07/19 p$ 0.55$
P 2016/07/31 VFIFX 30.15p$
P 2016/07/31 VTTSX 30.15p$

where the first row is an approximation of federal tax rate + state tax rate + 10% penalty. The last two rows are the current price in dollars but expressed at p$ to indicate that we haven’t paid taxes on this yet.

Automation

Now while I am not very concerned about the detailed movement of the funds we own, I want to be able to pull current prices for them without looking up every ticker symbol manually. The following script roughly achieves this goal. A brief walkthrough:

First, we query all commodity names from ledger and convert them into a hashmap.

# Load all commodity names from ledger.
raw = `ledger prices --prices-format '%a %(commodity)\n' --current | sort | uniq | tr -d '"'`

# Convert into hashmap.
symbols = raw.split("\n").map{|x| parts=x.split(" ", 2); { parts[0] => parts[1] } }.reduce(:merge)

Some cleanup is required as very few symbols in my ledger file don’t correspond to their Google Finance equivalent.

# Hard-coded mapping of symbols. I use the exact same symbols to track things
# as Google Finance except for euros where I use an abbreviation. Also, I have
# a separate commodity called "pre-tax dollar" for which I have hardcoded the
# conversion (and therefore don't need to look it up here).
mapping = {
  "EURO" => "CURRENCY:EURUSD",
  "p$" => nil
}

# Remove everything mapping to nil.
symbols.delete_if{ |sym, cur| mapping.has_key?(sym) and mapping[sym].nil? }

# Remember unmapped symbols in the same order as the mapped symbols.
unmapped_lookup_symbols = symbols.keys

# Map all symbols.
lookup_symbols = unmapped_lookup_symbols.map{|sym| mapping.has_key?(sym) ? mapping[sym] : sym }.join(",")

Now we just need to retrieve current data and output it in the right format for Ledger’s price db.

# Load data from google finance.
data = open("http://finance.google.com/finance/info?client=ig&q=#{lookup_symbols}").read
data = data.gsub(/\/\//, "")  # Kill eval() guard.
data = JSON.parse(data)  # Parse to json.

# Ensure we were able to find all symbols. This is mostly so we don't silently
# forget to update any symbols.
raise "Can not resolve all stock symbols" if data.size != symbols.size

# Cache stringified date for today.
date = Time.now.strftime("%Y/%m/%d")

# Output price db entries.
puts
data.each_with_index do |data,index|
  unmapped_sym = unmapped_lookup_symbols[index]
  puts "P #{date} \"#{unmapped_sym}\" #{data["l"]} #{symbols[unmapped_sym]}"
end

Again, the code for this is here.

Comments

Loading Chase.com transactions into Ledger

When trying to migrate away from Mint to Ledger, one of the major obstacles is automating the work of entering every 3 dollar coffee shop transaction manually. Ledger does provide some help in this area through the use of ledger xact, yet as of today, we enter 25 transactions per week into ledger and a large chunk of them is from our Chase credit cards. Automation seems to be the easiest way to make this a lot less painful.

Headless Selenium to the rescue.

Automating websites has changed quite a bit ever since lots and lots of Javascript is required for websites to work properly. The most sustainable way I could find to automate interactions with complex websites is Selenium, a framework for programmatically interacting with websites loaded and rendered in an actual browser.

Selenium commonly runs while interacting with an actual, visible browser. This however makes windows pop up on my machine which I don’t care about to I migrated to a headless implementation, in this case PhantomJS early on. This makes development a little trickier because you can’t observe what Selenium does and where it gets stuck but screenshotting mostly alleviates this problem.

The language of choice for this was ruby for no other reason than me being pretty familiar with it and it offering Selenium bindings as well as a reasonable amount of example code. Curiously, Chase seems to require the user-agent to look non-automated so this is the first hurdle to take care of while automating:

capabilities = Selenium::WebDriver::Remote::Capabilities.phantomjs("phantomjs.page.settings.userAgent" => "Mozilla/5.0 ...")
driver = Selenium::WebDriver.for
  :phantomjs,
  :desired_capabilities => capabilities

I mostly copied the user-agent string from my actual browser and that seemed to be enough. Since PhantomJS is a full browser, it takes care of all cookie handling and other features that might be required to get the Chase website to work.

Login & Frames :-(

What’s not trivial is realizing that the Chase website actually uses frames. Frames require special handling in Selenium so one has to realize that elements can’t be found because there’s a frame around the elements which needs to be entered first.

For Chase, we first navigate to a url displaying the login box:

driver.navigate.to "https://secure01c.chase.com/web/auth/dashboard#/dashboard/index/index"

Now we enter the frame the login inputs are located in and fill them

driver.switch_to.frame "logonbox"
user_element = driver.find_element(:id, 'userId-input-field')
user_element.send_keys(params["username"])
pass_element = driver.find_element(:id, 'password-input-field')
pass_element.send_keys(params["password"])
element = driver.find_element(:id, 'signin-button')
driver.save_screenshot('s1.png') if DEBUG
element.click
driver.switch_to.default_content

The code above enters the frame, fills the form, takes a screenshot if in debug mode and then logs us in. The last line exits the frame again as the remainder of the interaction happens outside of frames.

After successfully submitting the login, Chase may ask for a second authentication factor. The code on GitHub handles this case by asking for the OTP token that Chase emails to the address stored in their database; here I’ll obmit it for brevity.

Account discovery and CSV download.

Next we have to wait until the accounts overview is loaded, extract all account numbers and download a CSV file with the latest transactions.

wait.until { driver.find_element(:class, 'account') }
accounts = driver.find_elements(:xpath, '//*[contains(@data-attr, "CREDIT_CARD_ACCOUNT.requestAccountInformation")]')
driver.save_screenshot('s2.png')
accounts.each do |a|
  balance = a.find_elements(:xpath, './/*[@data-attr="CREDIT_CARD_ACCOUNT.accountCurrentBalance"]').first.attribute("innerHTML")
  number = a.attribute("id").gsub("tile-", "").to_i

  # Fetch CSV here, see later.
end

This code so far only, somewhat awkwardly, extracts the account number that we need to be able to fetch the CSV file. We fetch the CSV file by injecting Javascript code into the website which issues a POST request which obtains the CSV. This mimics what would happen if we scripted filling in the CSV download form and hitting the “Download” button. The reason we issue the request from javascript instead of filling the form is that downloading files in Selenium is fairly awkward, especially in PhantomJS. Running Javascript in the browser and returning the result however is simple and led to better code for this case.

script = <<-EOF
var out;
$.ajax({
  'async': false,
  'url': 'https://secure01c.chase.com/svc/rr/accounts/secure/v1/account/activity/download/card/list',
  'method': 'post',
  'data': { filterTranType: 'ALL', statementPeriodId: 'ALL', downloadType: 'CSV', accountId: '#{number}' },
  'success' : function(data, status, xhr) { out = data; }
});
return out;
EOF
csv = driver.execute_script(script);

This is pretty much it. Now we have a CSV file for all transactions for all accounts accessible through the supplied chase login. This can easily be translated to Ledger, either through its import methods or through Reckon.

I use the following Reckon command to convert Chase CSV to Ledger

reckon --ignore-columns 1,2 -l <Ledger file> --contains-header --unattended --account Liabilities:Chase -f <CSV file>

and this works quite well for me.

How often does it break?

In the last 4 months, I did not have to change any of the code. I did however once have to enable screenshotting to notice that Chase was serving a notice which one had to acknowledge before the accounts page. After manually doing that, the script worked again without modification. I have scripts for 2 others banks and I have not modified any of them. Bank websites don’t seem to change so much, it turns out.

The code for all this is here.

Comments
Blog by .